mapping
Geologic
Geologic mapping on the seafloor is nowhere near as easy as mapping on land. On land you can walk around the surface, describing what you see as you go. But high pressure, low temperature, and a total lack of light make it impossible to do the same thing underwater. Instead, we look at images of the seafloor and combine them with remotely-sensed data to create a detailed picture – a map.
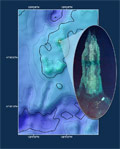
As we drive around the seafloor using the remotely-operated vehicle (ROV) Jason 2, we take careful note of certain features. Some of these include rock type, location of sulfide chimneys and diffuse venting, and the position and trend of structural features like faults or fissures. We collect these visual observations (photos and video) up to 10 m away from the vehicle, and can use them to make maps of the seafloor geology along a viewing “corridor”. These “strip maps” give us a valuable information about the composition of the seafloor. Numerous dives in one area can cover much of the local seafloor, discerning features like the boundaries between different basalt flow types or the number of sulfide chimneys in a vent cluster. With closely spaced dives, we can even suggest what the seafloor might look like in areas we haven’t yet seen. However, a typical dive can only visit a small part of the Endeavour axial valley. How do we figure out what’s going on in areas we haven’t yet seen?
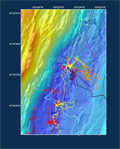
We use a series of remotely-sensed datasets to create a background map. These data can be collected from a ship, an ROV, or an autonomous underwater vehicle (AUV). Each of these can be equipped with a sonar system that transmits acoustic signals to the seafloor. When the signals reach the seafloor, they bounce off and are reflected back to receivers on the sonar. The time between the signal’ departure and return can be measured and converted into a seafloor depth. A whole collection of these depths can create a map of the seafloor topography, also called bathymetry. Bathymetric maps vary in their coverage and resolution. A ship-mounted sonar collects great amounts of data at low resolutions, while others, like the sonar mounted on the AUV ABE, have lower coverage but can resolve very small features on the seafloor. A ship-mounted sonar cannot image an individual vent field but can tell us a lot about the shape of the mid-ocean ridge in just a day or two. ABE’s sonar can image individual vents within a field, but would require weeks to cover the whole ridge. No visual data is collected with these sonar systems, but properties such as the slope and roughness of the seafloor can be determined. Therefore, most bathymetric maps show the geomorphology (shape) of the seafloor, but not its actual geology.
At the Endeavour vent fields, we use a combination of bathymetric maps and visual observations to create an integrated geology map. The detailed visual data from the strip maps is laid on top of the bathymetry, and we match the geologic observations (for example, pillow basalt) to the geomorphology (a 2 m high ridge). Using our knowledge of geology, we can extrapolate that the whole ridge is composed of pillow basalt. In this way, a geologic map of the whole area can be created.